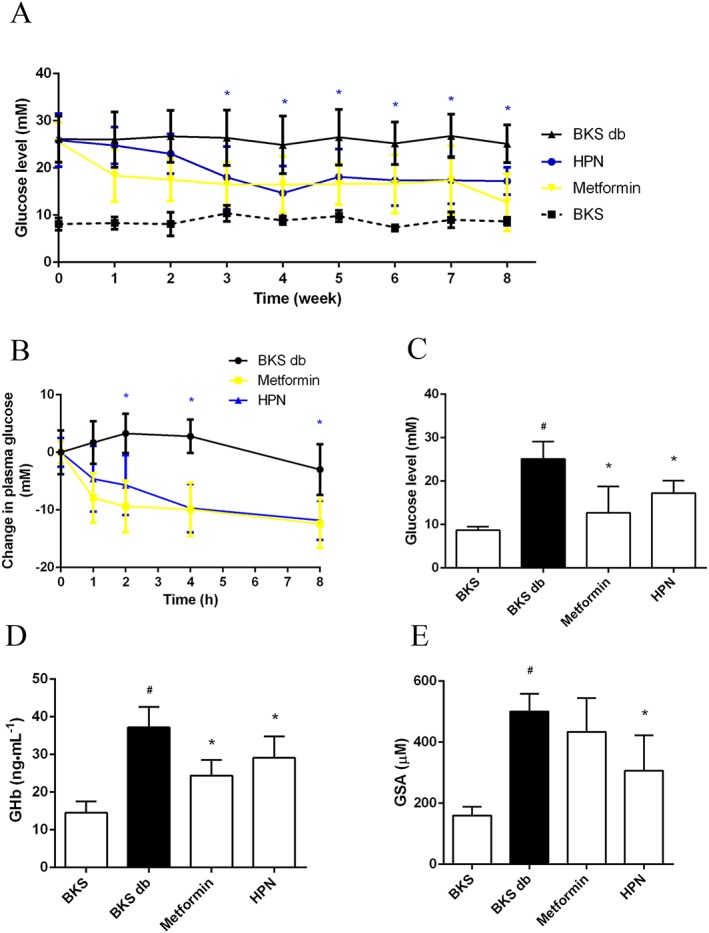
Figure 5.

Hpyerglycaemic effect of HPN. (A) Long‐term measurement of the blood glucose levels in BKS db mice after treatment with vehicle, HPN and metformin, and in BKS mice treated with vehicle after 6 h fasting. Data are expressed as mean ± SD (n = 8). *P < 0.05 (HPN group versus BKS db group). (B) Changes in plasma glucose levels of BKS db mice after treatment with vehicle, HPN and metformin. Data are expressed as mean ± SD (n = 8). *P < 0.05 (HPN group versus BKS db group). (C), (D) and (E) show the blood glucose levels, GHb levels and GSA levels at the eighth week respectively. Data are expressed as mean ± SD (n = 8). # P < 0.05 versus BKS group; *P < 0.05 versus BKS db group.
