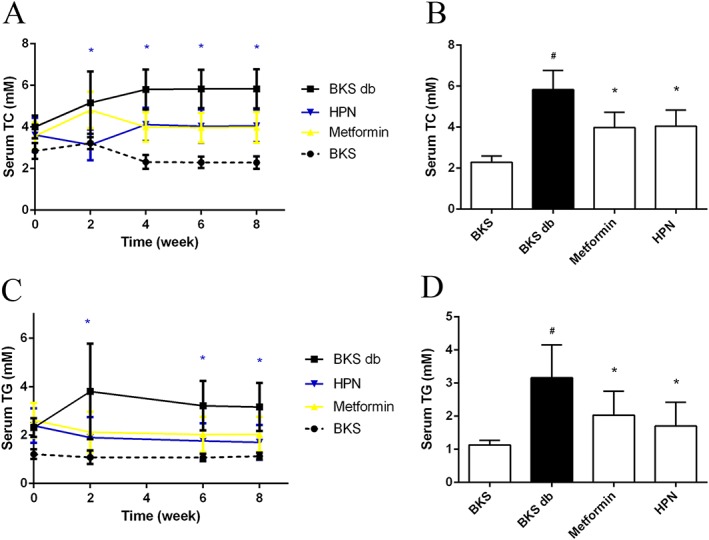
Figure 6.

Effects of HPN on dyslipidaemia during the 8 week treatment of BKS db mice. Data in (A) and (C) represent the serum TC and TG levels during 8 weeks of treatment with vehicle, HPN and metformin, and in BKS mice treated with vehicle. Data are expressed as mean ± SD (n = 8). *P < 0.05 (HPN group versus BKS db group). (B) and (D) show the serum TC and TG levels after 8 weeks of treatment respectively. Data are expressed as mean ± SD (n = 8). # P < 0.05 versus BKS group; *P < 0.05 versus BKS db group.
