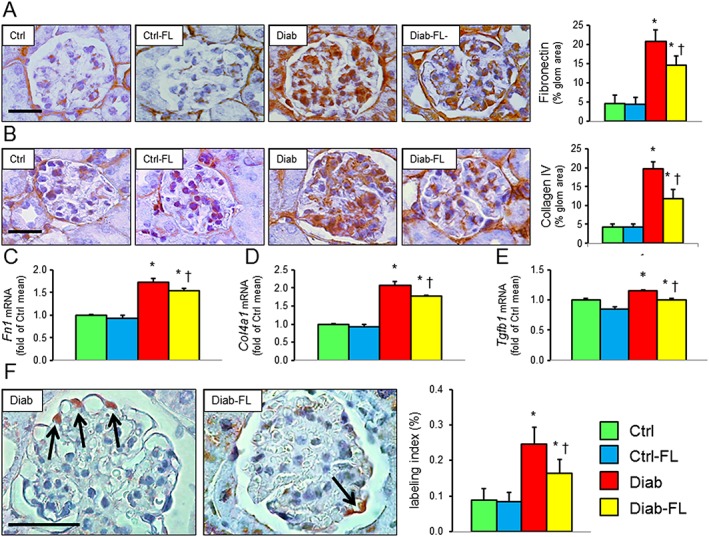
Figure 2.

Prevention protocol: glomerular extracellular matrix and cell apoptosis. IHC of kidney sections from representative animals and quantification of fibronectin (A) and collagen IV α1 chain (B); kidney mRNA expression of FN1 (C), Col4a1 (D) and Tgfb (E); IHC of kidney sections (original quantification 1000×) from representative animals and quantification of active caspase‐3 (F, arrows indicate positive cells) in untreated and FL‐926‐16 (FL)‐treated db/m control (Ctrl) and db/db diabetic (Diab) mice (mean ± SD; n = 5 per group). Scale bar = 50 μm. Post hoc multiple comparison: *P < 0.05 versus Ctrl; †P < 0.05 versus Diab.
