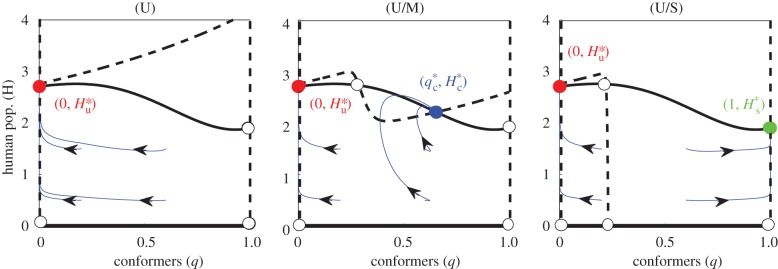
Figure 3.
Effect of the initial conditions on the long-term equilibria, for various ostracism strengths wmax. Cases (U), (U/M) and (U/S) correspond to the ostracism functions defined in figure 2a. Black curve: isocline  ; dashed curve: isocline
  ; white dots: unstable equilibria; green dot: (stable) sustainable equilibrium, (H*s, B*s, 1); red dot: (stable) unsustainable equilibrium, (H*u, B*u, 0); blue dot: (stable) coexistence equilibrium, (H*c, B*c, q*c ); transient trajectories are represented by the blue curves. See electronic supplementary material, table S1 for parameter values.

