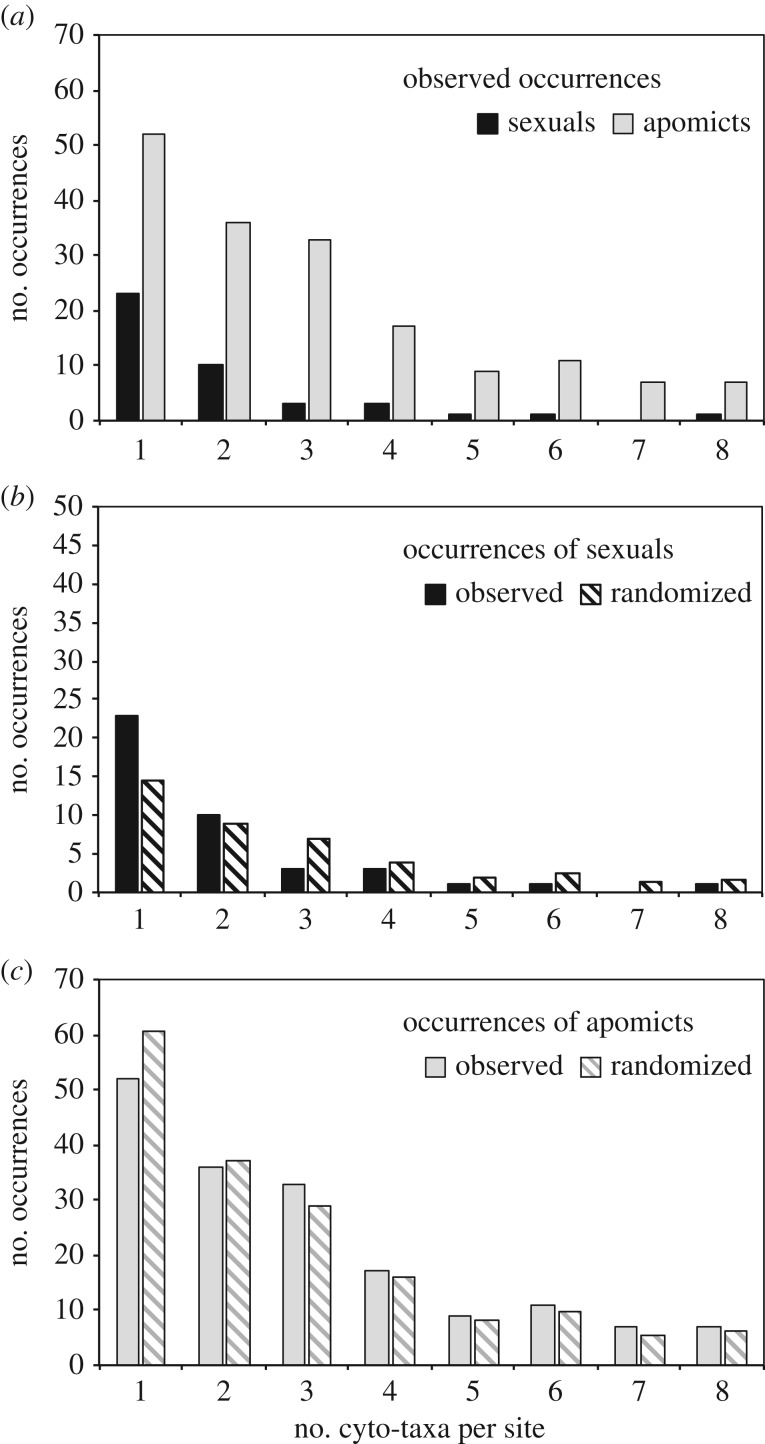
Figure 2.
Observed and random expectations for the number of cyto-taxa per site in the North American Crepis. (a) Histogram of observed complexity at 121 sites, broken down separately for apomicts and sexuals (e.g. of the 46 cyto-taxon observations representing the 23 sites with two cyto-taxa, there are 10 observations of diploids (sexuals) and 36 observations of polyploids (apomicts)). (b,c) Histograms comparing observed and expected (based on randomizations) occurrences of sexuals (b) and apomicts (c).

