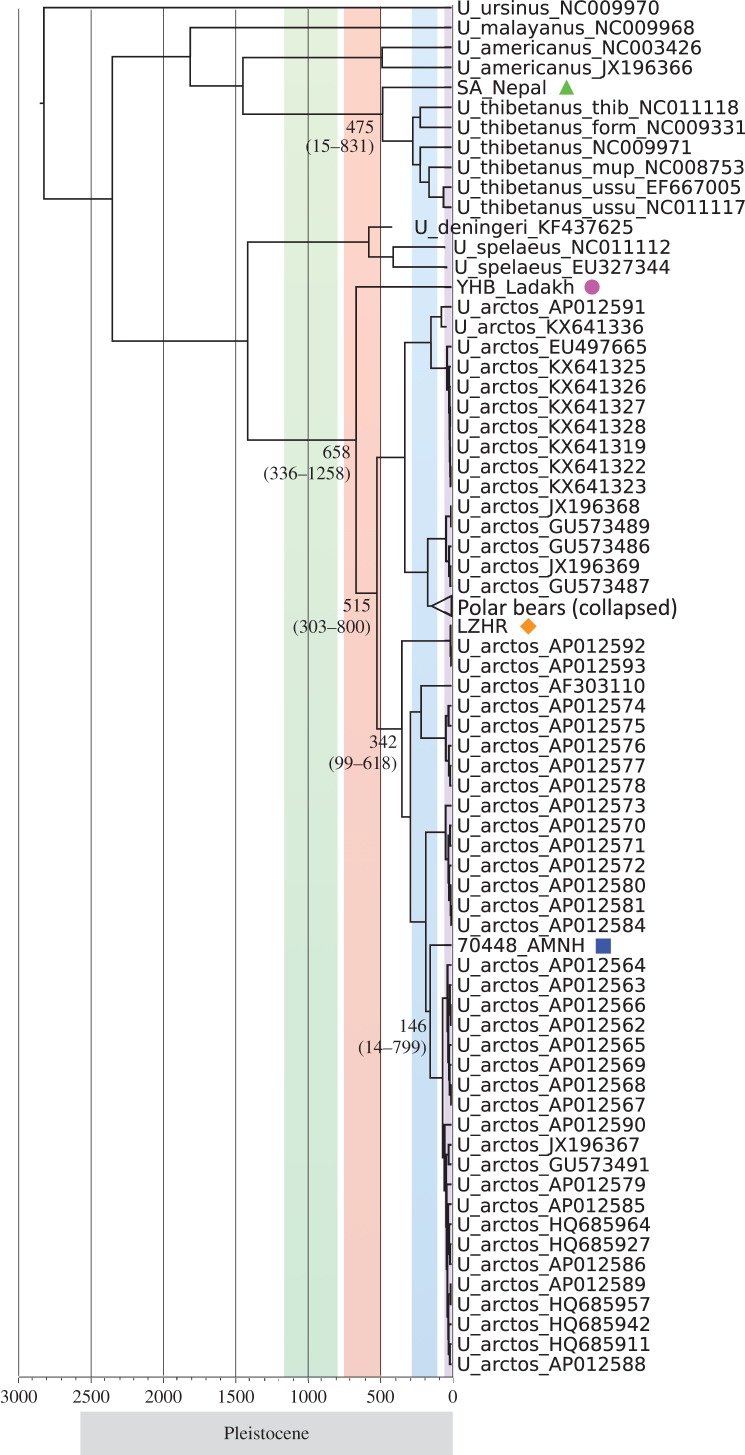
Figure 3.
Maximum clade credibility tree from a BEAST analysis based on complete mitogenomes. The numbers at nodes indicate the median estimated divergence time in ka BP (HPD values are shown in brackets and the lower scale indicates time in ka BP). The coloured vertical bars indicate, from left to right, time spans of four Pleistocene glaciations: the Xixabangma, Nyanyaxungla, Guxiang and Baiyu. New mitogenomes sequenced in this study are indicated with symbols as in figure 2. See electronic supplementary material, figure S4, for a complete version of the tree and divergence times estimated for all nodes.

