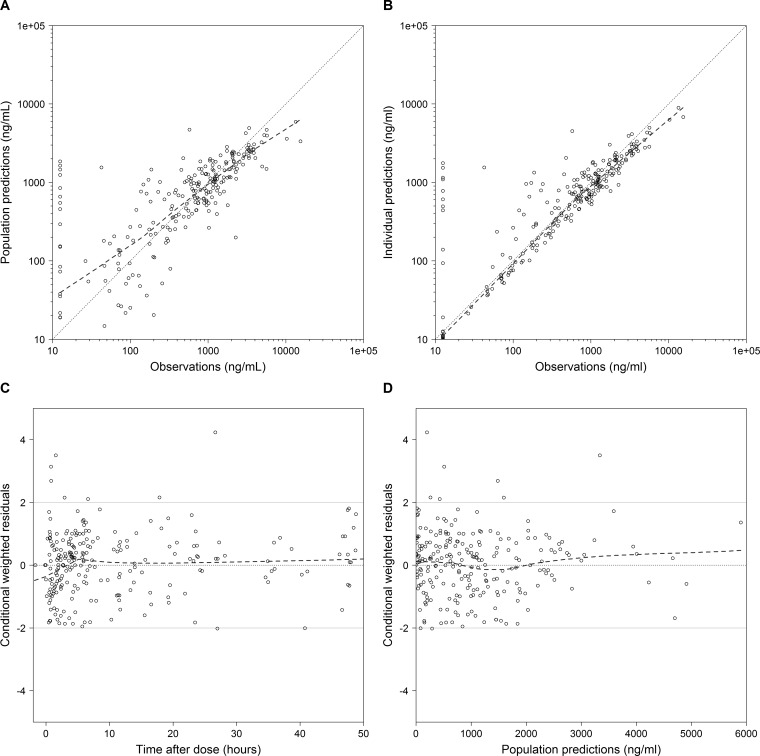
FIG 2.
TMP diagnostic plots for the final model. (A) Observed versus population predictions; (B) observed versus individual predictions; (C) conditional weighted residuals versus time; (D) conditional weighted residuals versus population predictions. The dashed lines represent the loess curve. The solid grey lines represent conditional weighted residual values of 0 and ±2. Concentrations below the lower limit of quantifications (LLOQ) were imputed as LLOQ/2.

