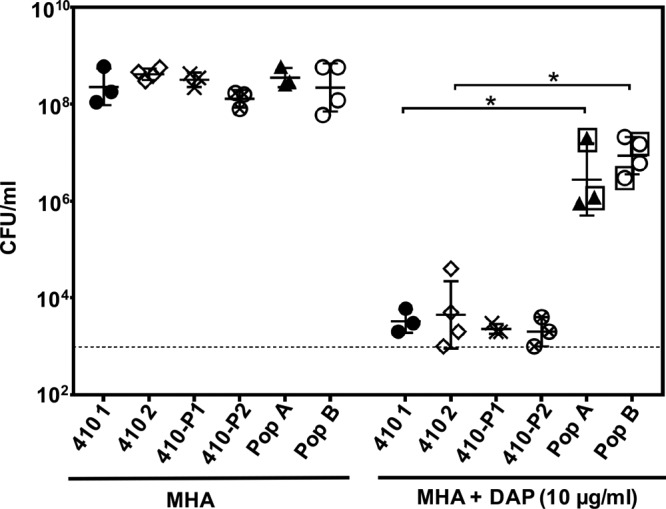
FIG 2.

Reduced DAP susceptibility in CHX-passaged E. faecium populations A and B. The geometric mean and the geometric standard deviation of the CFU/ml count for n = 3 or 4 independent trials are shown. Strains and populations are described in the text. The dashed line represents limit of detection (103 CFU/ml). The boxed populations were analyzed by whole-genome sequencing. *, P < 0.05 (one-tailed Student t test).
