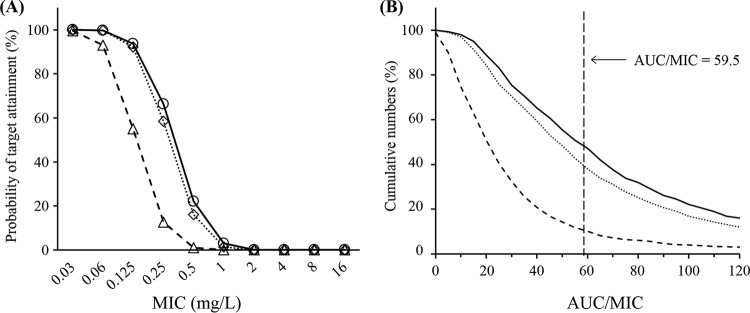
FIG 4.
Probability of target attainment achieved with 2 g AZM-SR, 2 g AZM, and 1 g AZM at each MIC and the cumulative probability of AUC/MIC distributions calculated by Monte Carlo simulation. (A) The plots show data for 2 g AZM-SR (open circles, solid lines), 1 g AZM (open triangles, dashed lines), and 2 g AZM (open diamonds, dotted lines). (B) Each line represents 2 g AZM-SR (solid lines), 1 g AZM (dashed lines), and 2 g AZM (dotted lines).

