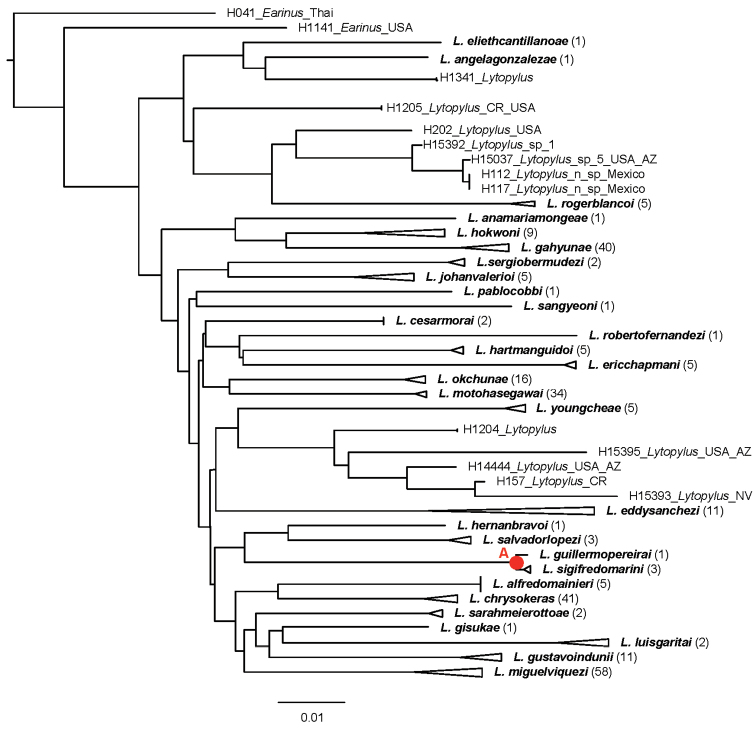
Figure 1.
The NJ tree of the COI DNA barcode region for twenty-nine of the thirty-three Lytopylus species treated here. Triangles represent collapsed clades; their lengths (measured horizontally) represent the distance from the most basal node to the apex of the longest branch. The number of specimens in each triangle is given in parentheses following the species name. The node labeled with a red “A” is discussed in the text.

