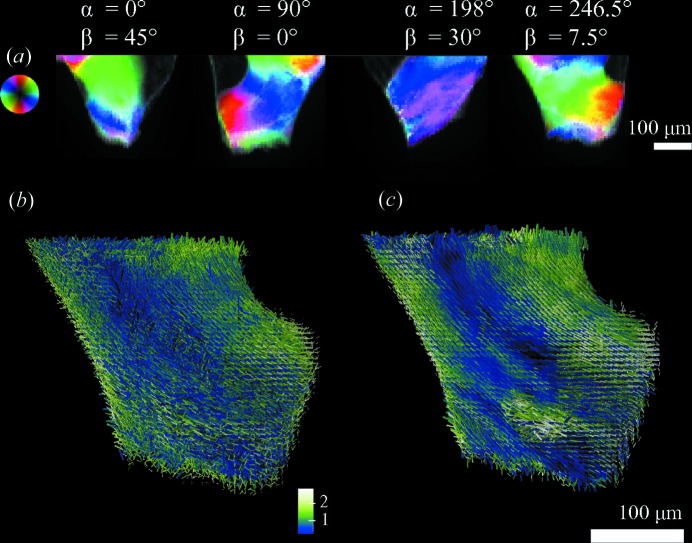
Figure 12.
Orientation of the bone ultrastructure from a human trabecular bone (sample C). Four two-dimensional SAXS projections at different sample orientations are shown in (a), where the colour wheel represents the main scattering orientation, the hue the scattering intensity and the degree of orientation the colour saturation. The orientation of the bone ultrastructure retrieved from SAXS tensor tomography is shown in (b) and (c), where the colour represents the degree of orientation and the length of the isotropic component  . (b) Reconstruction without regularization applied and (c) with regularization of the spherical harmonics coefficients
  and on the direction
  as described in the text.

