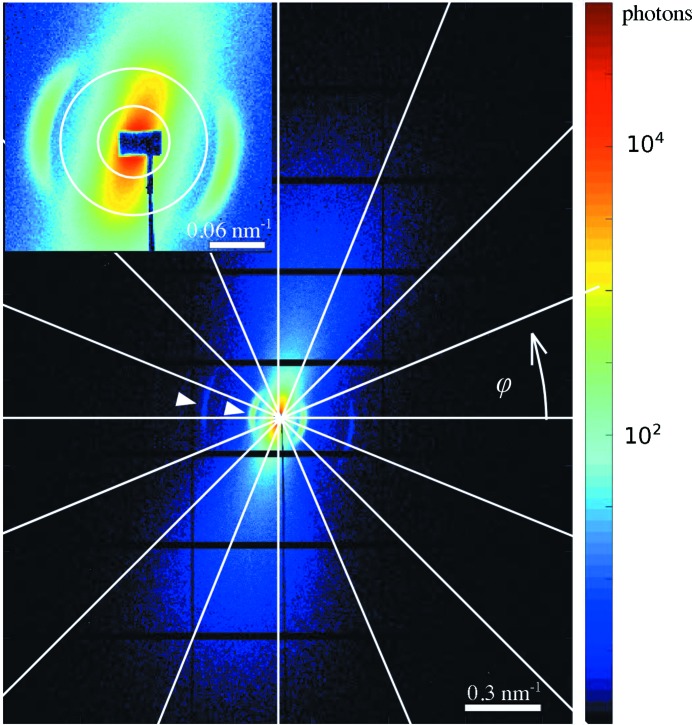
Figure 4.
Two-dimensional scattering pattern in logarithmic scale obtained from a thin slice of trabecular bone and a zoom-in to the low-q range. The 16 segments in which the radial integration is performed are indicated by white lines and two circles that mark a range of q values. White triangles point at the pronounced first and the faint third diffraction orders of mineralized collagen fibres.

