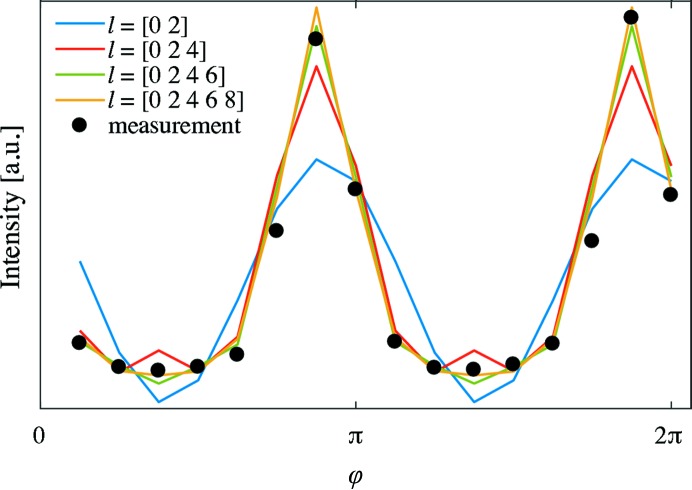
Figure 5.
SAXS measurements from a single voxel for q = (0.0379–0.0758 nm−1) for one sample rotation angle β = 20° are shown with black dots. The corresponding modelled data (lines) with different degrees l and zero order m of spherical harmonics are shown as a function of the azimuthal angle φ in the detector plane.

