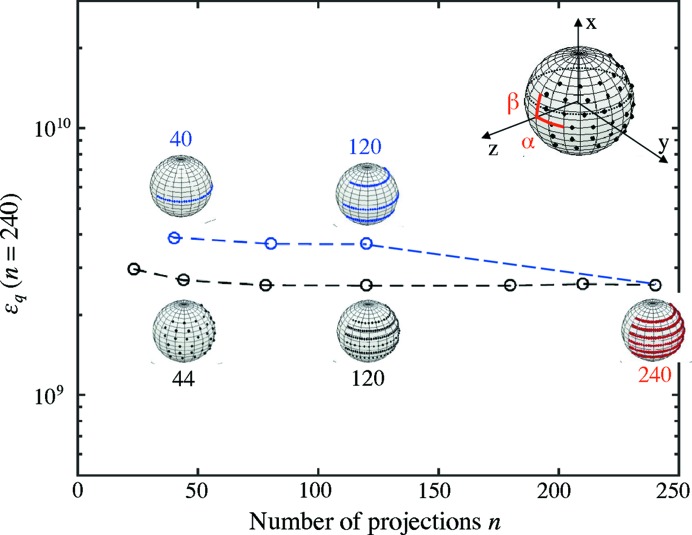
Figure 8.
The error according to equation (4) between the modelled intensity and all measured projections (= 240) as a function of the number of projections used in the optimization. The two curves show the error metric for data sets where the projections are reduced by keeping constant either  (blue) or
  (black). The spherical insets show the angular sampling schematically drawn on a sphere, where each object orientation (α, β) can be represented by a point on the hemisphere.

