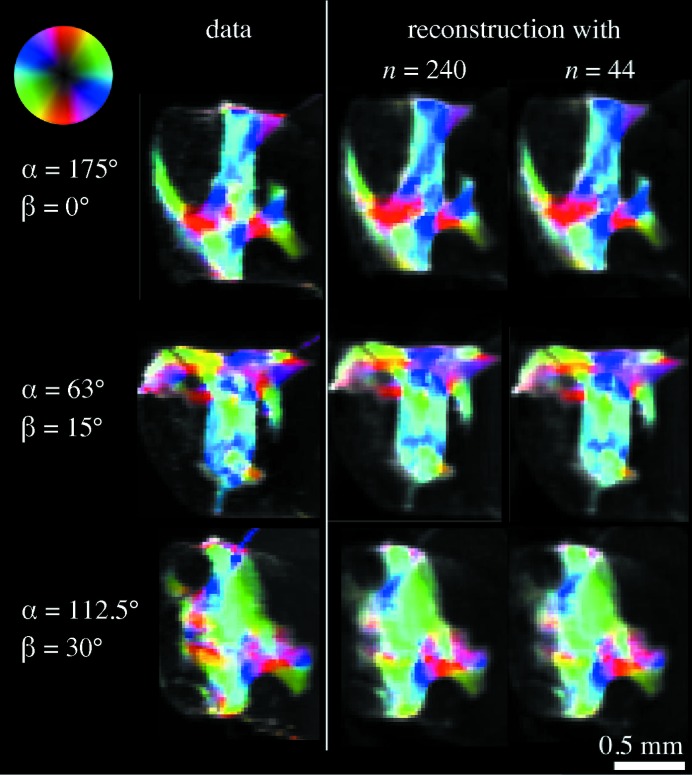
Figure 9.
Comparison between measured two-dimensional scanning SAXS projections and the equivalent projection obtained from the reconstruction using subsets of the data corresponding to  and 44 sample orientations. The colour wheel represents the main scattering orientation, the hue the scattering intensity, and the degree of orientation the colour saturation.

