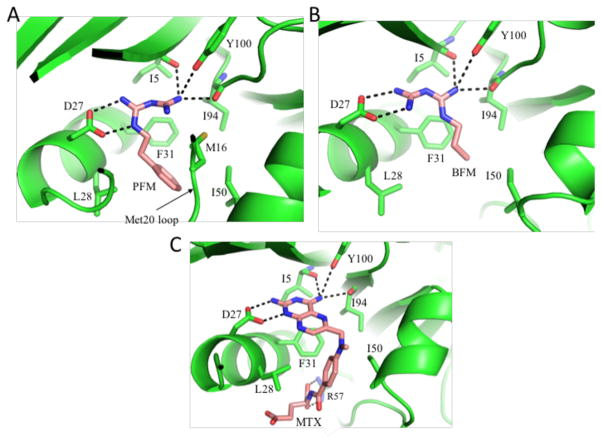
Figure 1. Structures of ecDHFR complexed with phenformin and buformin.
A) Ribbon diagram showing the active site of the ecDHFR-phenformin complex. Major sidechain interactions with PFM are indicated. B) Ribbon diagram showing a similar complex with buformin. C) Ribbon diagram illustrating the analogous interactions with bound methotrexate (pdb: 1RA3). Hydrogen bonds are indicated with black dashed lines.

