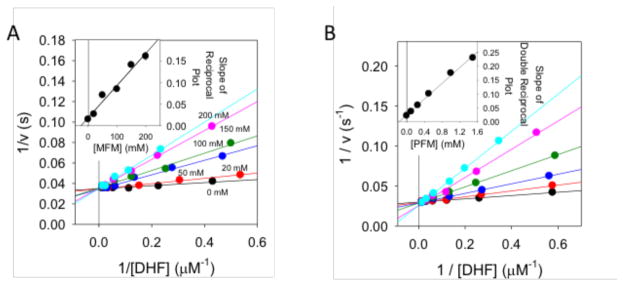
Figure 4. Determination of metformin inhibition constant for ecDHFR.
A) Lineweaver-Burk plot for the inhibition of ecDHFR with Metformin (MFM). All of the lines intersect at the same point on the y-axis indicating competitive inhibition of MFM with DHF. The inset shows the slopes plotted versus [MFM]. Error bars from fits of the slopes are shown. A fit of the data (R2 = 0.970) yields a Ki of 24 ± 7 mM for MFM. A non-linear fit of all of the data yielded a Ki = 17.9 ± 3.5 mM. B) Lineweaver-Burk plot of PFM inhibition of ecDHFR. The pattern of intersecting lines indicates competitive inhibition. The slopes are plotted versus [PFM] in the inset plot. Error bars for the slopes are shown. A fit of the data (R2 = 0.992) yields a Ki of 0.17 ± 0.02 mM.

