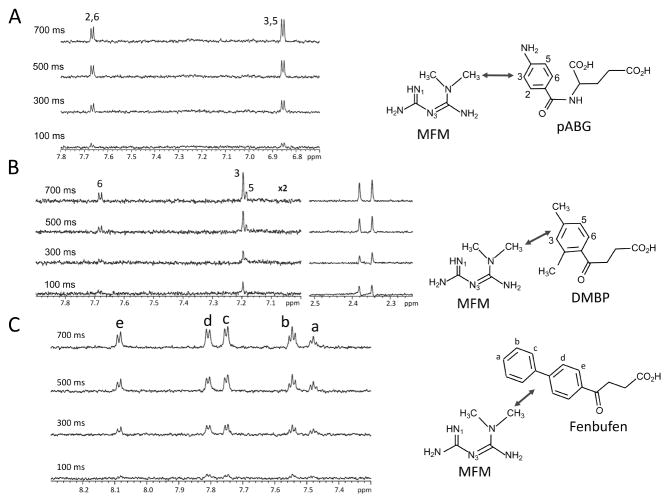
Figure 5. ILOE build-up data for MFM and ligands bound to the pABG subsite.
A) A series of 1D NOE spectra obtained at the indicated mixing times by irradiating the MFM methyl resonance at 3.04 ppm and observing the pABG aromatic resonances. The corresponding interacting nuclei are shown on the right hand side. B) 1D ILOE build up data for a sample containing 5 mM MFM + 5 mM hippurate analog DMBP. C) 1D ILOE build up data for a sample containing 5 mM MFM + 2 mM Fenbufen. Samples for A and B contained the 0.1 mM ecDHFR, 5 mM of the ligands under evaluation, in the standard screening buffer: 25 mM phosphate, pH 6.8 (uncorrected electrode reading), 100 mM NaCl, 1 mM TCEP, 0.25 mM NaN3 in D2O. Sample for C also contained 2% DMF to improve the solubility of Fenbufen. Spectra were run at 25 °C. Double-headed arrows indicate ILOE interactions.

