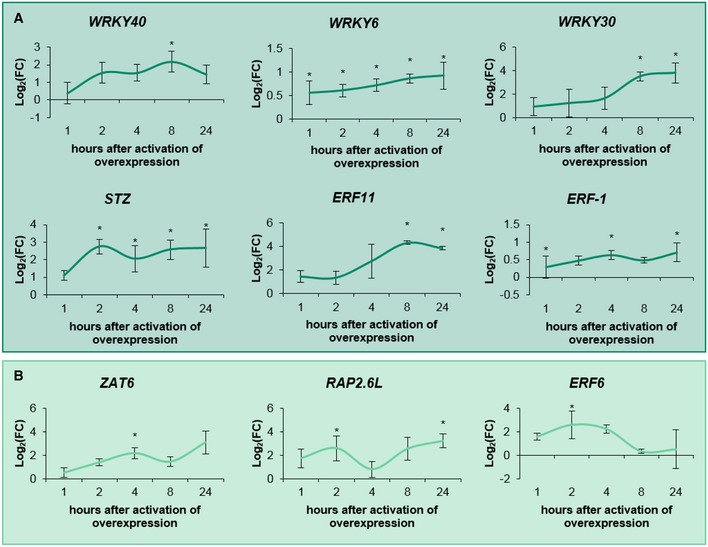
Expanding leaf tissue (third leaf – 15 DAS) of WRKY15‐GR was harvested 1 h, 2 h, 4 h, 8 h, and 24 h after transfer to dexamethasone. Expression values were normalized against the control line.
WRKY15 target genes (significantly differentially expressed during one time point) that showed a gradually increasing expression pattern.
WRKY15 target genes that showed an oscillating expression pattern.
Data information: data are presented as mean ± SEM,
n = 3 independent experiments, *FDR < 0.1 (mixed model analysis, user‐defined Wald tests).

