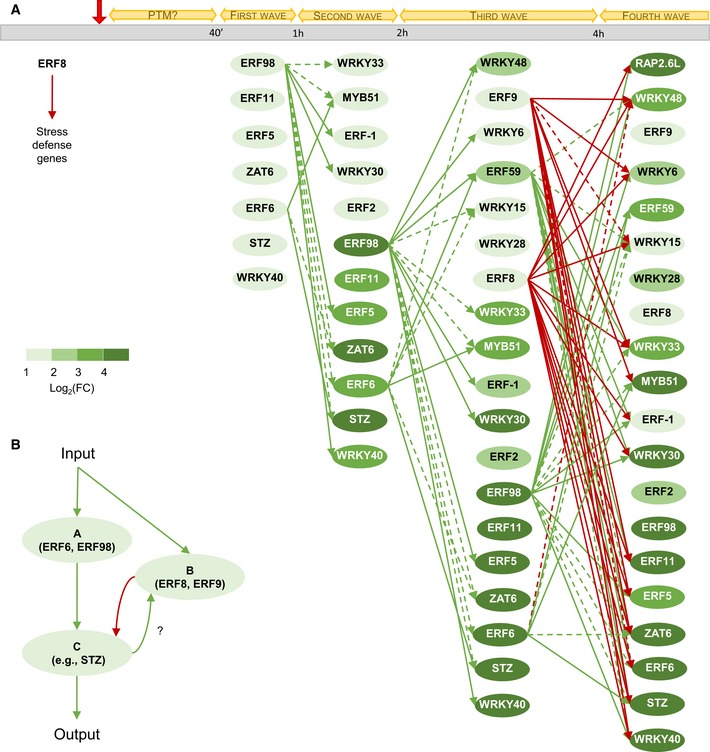
We speculate that under normal conditions, ERF8 represses the other network genes. Upon mild osmotic stress (indicated by a red arrow), some genes of the network can be phosphorylated (PTM), a hypothesis based on the literature and the abundance under normal conditions. Subsequently, the expression of the network genes increases during four groups of transcriptional induction. The direct transcriptional regulations of the core network members (ERF6, ERF8, ERF9, ERF59, and ERF98) are depicted with green and red arrows, representing activation and repression, respectively. The regulatory connections of the core network members that were identified when evaluating the effect of two TFs together on a shared target gene are depicted with dashed green and red arrows, representing activation and repression, respectively. The latter regulatory interactions occur in the presence of a necessary transcriptional partner. The color of the nodes represents the strength of the induction. FC = fold change.

