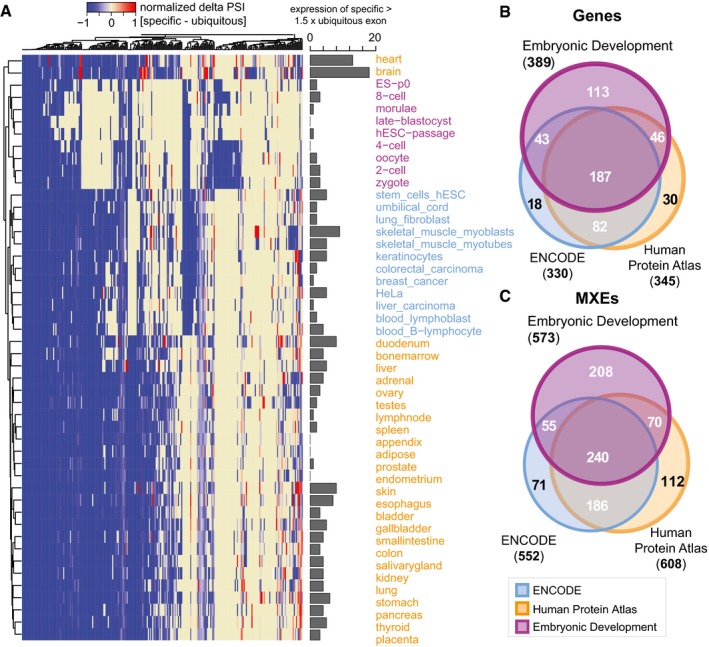
Heatmap showing all differentially expressed MXE clusters with at least three RPKM. Here, we used the Gini coefficient, which is a measure of the inequality among values of a frequency distribution (Ceriani & Verme,
2012) and has successfully been used to determine tissue‐enriched gene sets (Zhang
et al,
2017), to determine highly tissue‐specific MXEs (maximum normalized Gini index of cluster) and MXEs with a broad tissue expression distribution (minimum Gini index). For each MXE cluster, the per cent‐spliced‐in (PSI) value of the ubiquitous MXE (minimum Gini index) is subtracted from the PSI value of the specific MXE (maximum Gini index of cluster) (delta PSI value) and scaled between −1 (broad tissue distribution) and 1 (highly tissue specific). Each column represents an MXE pair, and each row represents MXE expression in a tissue, cell type or at a developmental time point. The bar graph summarizes counts where the specific MXE is 1.5‐fold more spliced in than the ubiquitous MXE.