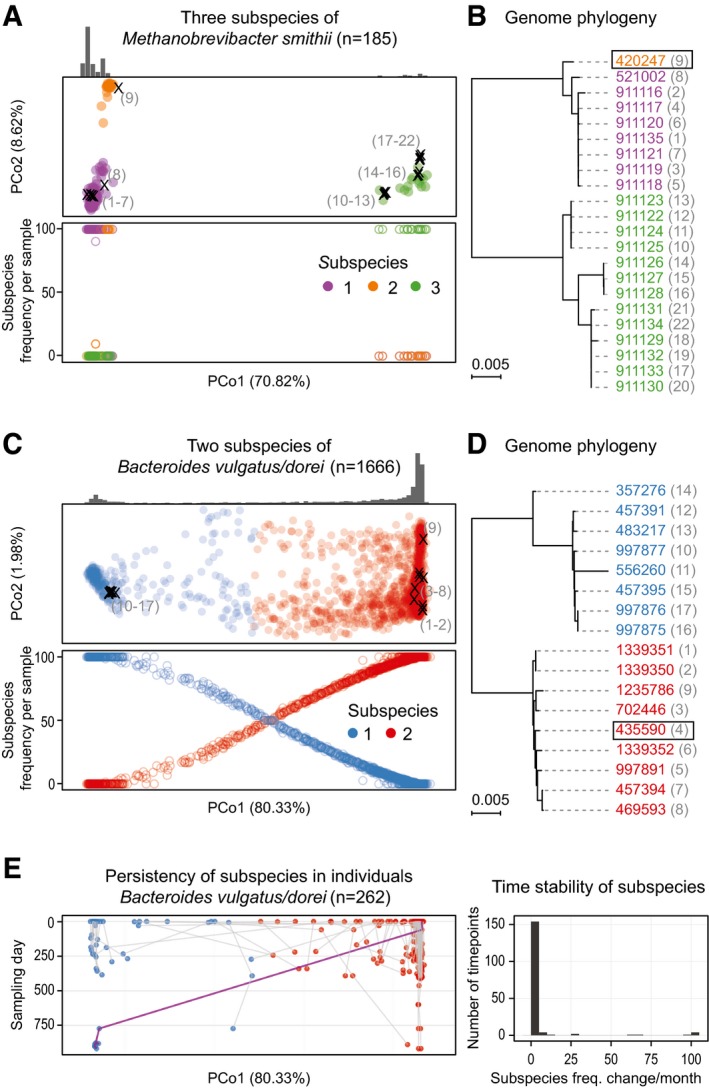
Subspecies identified for
Methanobrevibacter smithii and
Bacteroides vulgatus/dorei are shown in principal coordinate (PCoA) projections of the between‐sample distances based on single‐nucleotide variations (see
Materials and Methods). The first principal coordinate (PC) explains over 70% of the variation in both cases (panels A and C). Reference genomes have been projected into the same PCoA plots (marked with “×” in A and C; see
Materials and Methods). The numbers adjacent to the placed genomes correspond to those shown in parentheses next to NCBI taxonomy identifiers (leaves) on the phylogenetic trees in (B, D), respectively. The sample density for each subspecies is highlighted by the histogram above, and the total number of samples in which the species could be quantified is indicated in headers. Quantification of the frequency of each subspecies (bottom plot in A and C) reveals that for
M. smithii, only one sample has two subspecies co‐occurring in one individual, while all the others have a single dominating one. In contrast, for
B. vulgatus/dorei, co‐occurrence is more commonly observed. Phylogenies reconstructed from the reference genomes (NCBI taxonomy identifiers; see
Materials and Methods) are fully consistent with the SNP‐based clustering. The representative genome for each species, relative to which genomic variants were called, is highlighted with a box.