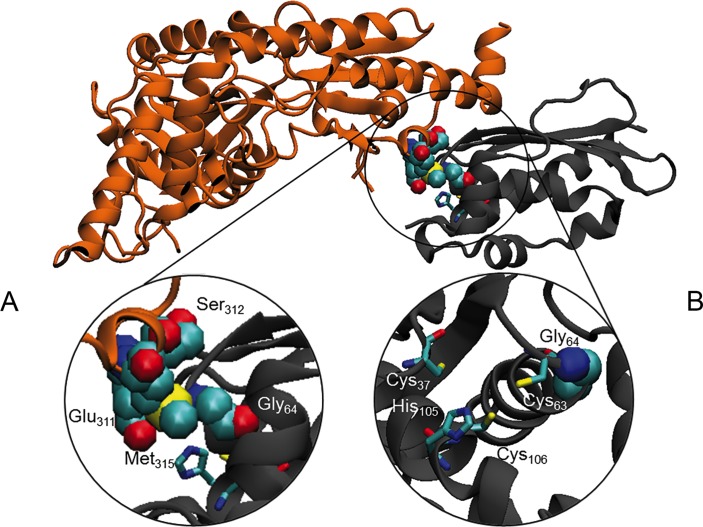
Figure 5.
In silico structural analysis. (A) Ribbon diagram of the Escherichia coli IscS (coloured in grey)-IscU (coloured in orange) complex (PDB ID: 3lvl). Close view of the Gly64 of IscU and Glu311, Ser312 and Met315 of IscS represented in Van der Waals and coloured by type. (B) Residues supposed to be involved in the co-ordination of the 2Fe-2S are represented as sticks.

