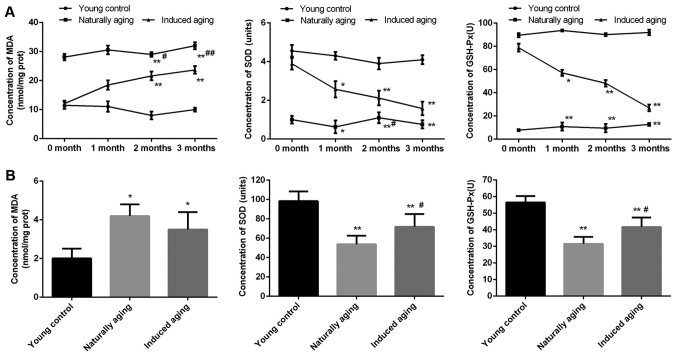
Figure 1.
Concentration of MDA, SOD and GSH-Px in the induced aging group and naturally aging group compared to the young control group. (A) The levels of MDA, SOD and GSH-Px in the serum. (B) The levels of MDA, SOD and GSH-Px in the brain. *P<0.05 and **P<0.01 vs. young control group; #P<0.05 and ##P<0.01 naturally aging vs. induced aging group. MDA, malondialdehyde; SOD, superoxide dismutase; GSH-Px, glutathione peroxidase.

