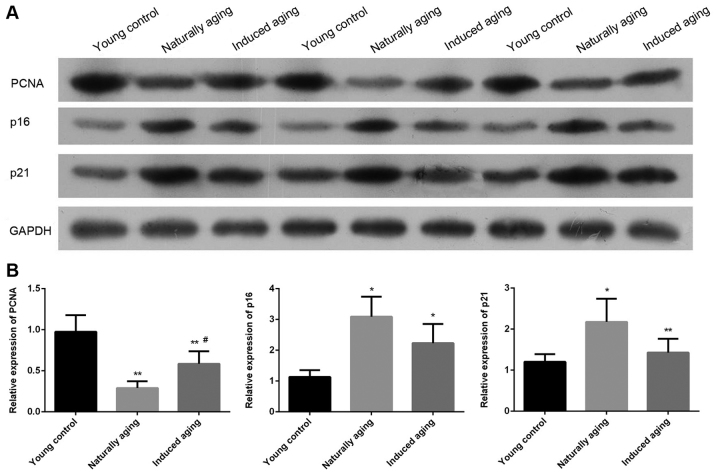
Figure 7.
Changes in the expression level of PCNA, p16 and p21. (A) Western blot analysis of the level of PCNA, p16 and p21. Equal protein loading was verified by measurement of GAPDH level. (B) The relative expression level of PCNA, p16 and p21 were indicated by qPCR. *P<0.05, **P<0.01 vs. young control group, #P<0.05 vs. naturally aging group. PCNA, proliferating cell nuclear antigen.

