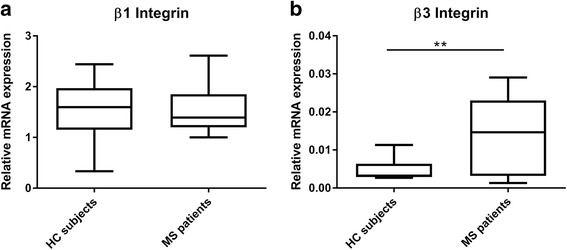
Fig. 3.

β1 and β3 integrin mRNA levels in MS patient/HC subject-derived monocytes. qPCR analysis was performed to detect a β1 integrin (HC N = 8/MS N = 14) and b β3 integrin (HC N = 7/MS N = 15) mRNA levels in primary monocytes from MS patients and HC subjects. Data are shown in box-and-whiskers plots in which the median is represented by a horizontal line within the box, and the lower and upper whiskers represent the 5 and 95 percentiles. **p < 0.01. MS multiple sclerosis, HC healthy controls
