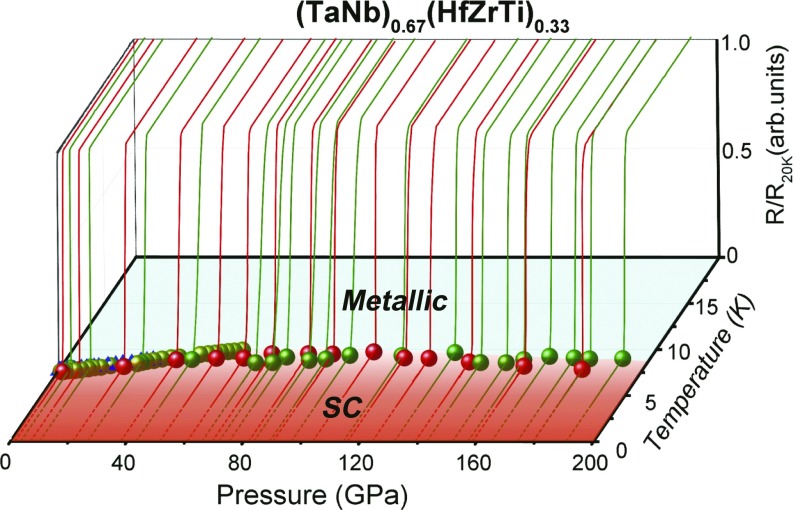
Fig. 3.
Phase diagram of superconducting transition temperature vs. applied pressure up to 190.6 GPa for the HEA, combined with plots of the corresponding resistance vs. temperature. Blue triangles and dark-yellow balls in the diagram represent the zero-resistance superconducting transition temperature TC obtained from measurements at pressure below 60 GPa, while the red and olive balls stand for zero-resistance TC from the measurements at pressures up to 179.2 and 190.6 GPa, respectively.

