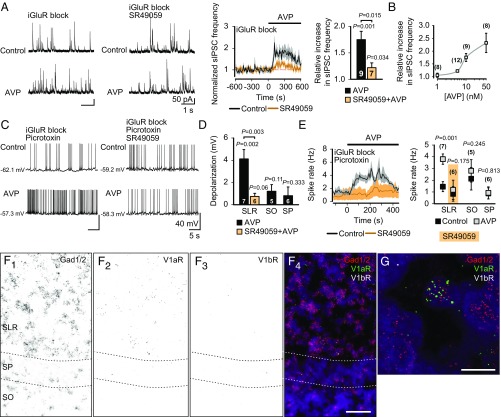
Fig. 4.
AVP activates P0–P2 CA3 SLR interneurons via V1aRs. (A) Sample traces of whole-cell voltage-clamp recordings (Left) and mean normalized frequencies (Center and Right) of sIPSCs measured from CA3 pyramidal neurons before and during bath application of AVP (10 nM). AVP induced an increase in sIPSC frequency, which was significantly smaller in the presence of SR49059 (20 nM). (B) AVP concentration-response curve (1–50 nM) on normalized peak sIPSC frequency. (C) Whole-cell current-clamp recordings from visually identified hippocampal CA3 interneurons from P0–P2 VGAT-Venus transgenic rat slices before and during bath application of AVP (in the presence of iGluR block and picrotoxin). Sample traces of SLR interneurons in the absence (Top) and presence (Bottom) of SR49059 are shown. (D) Depolarization of interneurons from SLR (in the absence or presence of SR49059), SO, and SP upon application of AVP. (E, Left) Continuous quantification of the mean spike rate of SLR interneurons before and during bath application of AVP. (E, Right) Comparison of spike rates (control vs. peak effect of AVP) of interneurons from SLR (in the absence or presence of SR49059), SO, and SP before and during application of AVP. Data are presented as mean ± SEM, and n values are provided in the figure. Paired and independent t tests were used for statistical analysis. See Fig. S6 for additional data on SO and SP interneurons. (F and G) In situ hybridization with fluorescent probes against Gad1 and Gad2, V1aR, and V1bR mRNA transcripts in the CA3 region of the P0 rat hippocampus (n = 5 brains). (F1) Gad1/2 mRNA black puncta label interneurons in all layers. (F2) V1aR mRNA is predominantly expressed in the SLR. (F3) V1bR mRNA expression was not detected in the CA3 area. (F4) Merge of F1–3. (Scale bar: 50 μM.) (G) Confocal image taken from the SLR. V1aR mRNA (green) localizes to a Gad1/2-positive cell (red). (Scale bar: 10 μm.) DAPI (purple) was used for nuclear staining. A positive control of the V1bR mRNA probe is shown in Fig. S7.

