Fig. 6.
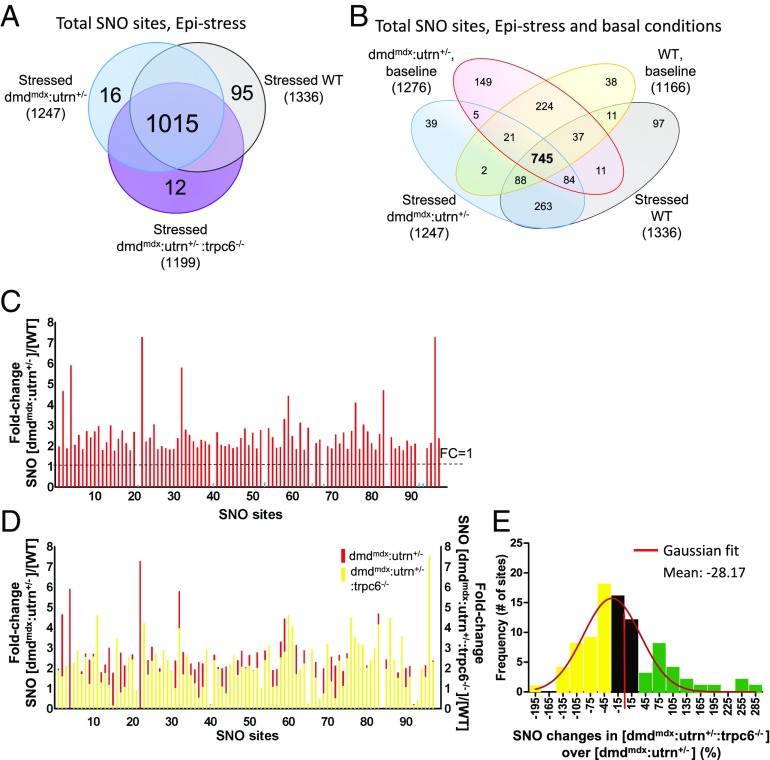
Influence of epinephrine (Epi) stimulation on SNO proteome in three experimental groups. (A) Venn diagram shows total number of SNO sites identified in Epi-stressed control, dmdmdx:utrn+/− and dmdmdx:utrn+/−:trpc6−/−. (B) Four-way comparison of SNO sites observed in WT and dmdmdx:utrn+/− myocardium ± Epi. (C) Fold change in S-nitrosylation level comparing dmdmdx:utrn+/− with WT. Overall, SNO changes were increased at similar sites in dmdmdx:utrn+/− in the presence of Epi. (D) Fold change in S-nitrosylation level comparing dmdmdx:utrn+/− (red) with dmdmdx:utrn+/−:trpc6−/− (yellow). While some S-nitrosylation levels declined in individual sites, the overall effect was more modest than observed without Epi. (E) Histogram of the relative percent change in S-nitrosylation between dmdmdx:utrn+/− and dmdmdx:utrn+/−:trpc6−/−. Among 90 hyper-SNO sites, 44% were reversed by 30% or more with Trpc6 deletion (yellow), and 22 sites were increased further by 30% or more (green).

