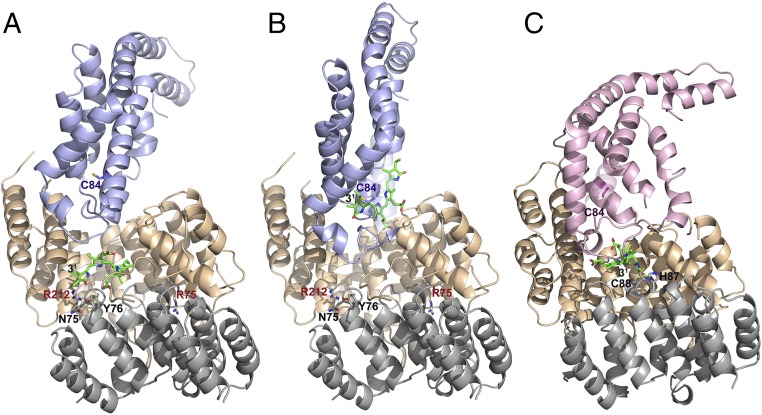
Fig. 2.
Docking of E/F-type lyase with PBPs. (A) Energy-minimized arrangement of apo-CpcA docked to PCB-loaded CpcE/F. This arrangement mimics the chromophorylation process. A zoom into the active site is shown in Fig. S4A. (B) PCBT–CpcA docked to empty CpcE/F. This situation corresponds to the beginning of detachment of the PCB chromophore from PCB–CpcA. A zoom into the active site is shown in Fig. S4B. (C) Docking of PecE/F loaded with PCB to apo-PecA. In the PecE/F complex, H87C88 are located at the loop between h20 and h21; as these residues are necessary for the isomerase activity, the complexed PCB chromophore is placed in the vicinity of H87C88 of PecF. The zoomed active site is shown in Fig. S4D. The structure of PCBT–CpcA is taken from the reported structure of CPC from Synechococcus elongatus (PDB ID code 4ZIZ), and that of the apoprotein is modeled from CPC holoprotein (PDB ID code 4ZIZ). The structure of CpcE/F loaded with PCB is obtained by fitting PCB from the CpcT–PCB crystal structure (PDB ID code 4O4S) into the empty CpcE/F heterodimer (this work). The structure of PecA is modeled from the reported structure of α-PEC (PDB ID code 2J96). The structure of PecE/F is simulated based on the present structure of CpcE/F (Fig. S2), followed by fitting the chromophore into the cavity and energy-minimization. CpcE and PecE are shown in brown, CpcF and PecF in gray, CpcA in blue, and PecA in violet.

