Fig. 1.
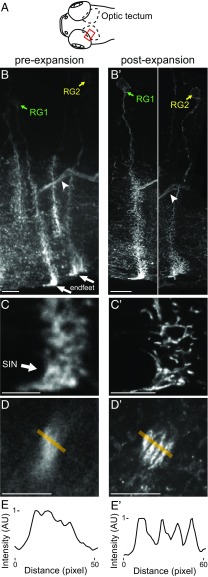
ExM helps resolve the morphology of fine cellular processes. (A) Schematic of the larval zebrafish brain showing the imaged area (red rectangle) within the left optic tectum. (B and B′) Maximum intensity projections of part of the tectum (highlighted in red in A) of a 6-d postfertilization larval zebrafish sparsely expressing membrane-bound EGFP and stained for GFP preexpansion (B) and postexpansion (B′), showing radial glial cells (two of which are labeled RG1 and RG2) and projection fiber bundles (arrowheads). (C and C′) Single confocal slices show projections of cell RG1, preexpansion (C) and postexpansion (C′). Endfeet processes of this cell wrap around the cell body of a superficial interneuron [SIN (113); arrow]. (D and D′) A bundle of extratectal fibers preexpansion (D) and postexpansion (D′) from the regions highlighted by arrowheads in B and B′, respectively, is shown. (E and E′) Intensity plots along the orange line in D and D′, respectively. AU, arbitrary units. [Scale bars: B, 10 μm; B′, 10 μm (physical size postexpansion, 35 μm); C and D, 5 μm; C′ and D′, 5 μm (17.5 μm).]

