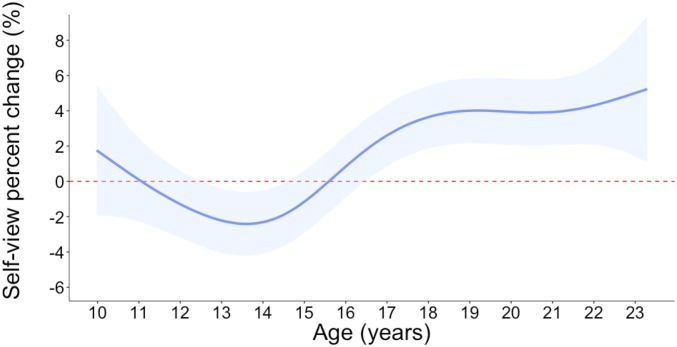
Fig. 4.
Task-induced changes in self-views differed across development. Graph shows blue fit line of predicted values of the percent change in self-esteem score pretask vs. posttask based on the thin plate regression smoothing spline model. Blue shading indicates the SEM. Red dotted line denotes no change in self-views.

