Fig. 1.
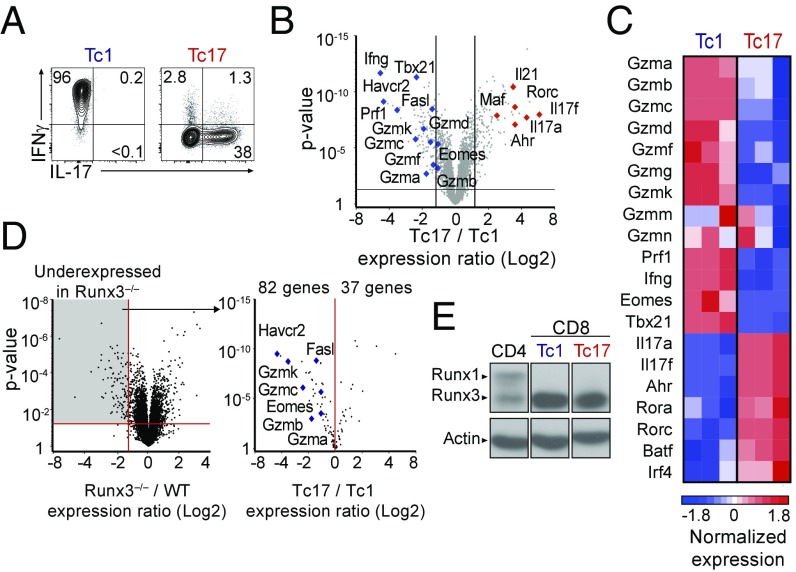
The Tc17 transcriptional program represses cytotoxic functions. (A) Contour plots of IL-17 vs. IFNγ expression on CD8+ T cells cultured under Tc1 and Tc17 conditions. (B) Volcano plot displays Tc17/Tc1 expression ratios (log2 values, full gene set) vs. P values; each symbol represents a distinct gene. Relevant genes are indicated. Data are from three replicates. Lines represent 1.5-fold change, P value 0.05. (C) Heatmap displays normalized expression on selected genes in Tc1 and Tc17 cells (Z score, color scale at Bottom). Data are from three replicates. (D) Volcano plot (Left) displays expression ratios (log2 values, full gene set) vs. P values of differential expression in Runx3−/− over wild-type CD8+ T cells; original data are from ref. 26. The Right volcano plot displays Tc17/Tc1 expression ratio vs. P values of differential expression for genes significantly underexpressed in Runx3−/− cells (1.5-fold change, P < 0.05, gray shading on Left plot). Each symbol represents a gene; relevant genes are indicated. (E) Immunoblot analyses of Runx protein expression in effector CD4+ (ThN) or CD8+ T cells cultured under Tc1 or Tc17 conditions. Data are representative of five (A) or two (B–D) mice analyzed in four (A) or two (B–D) independent experiments.

