Fig. 2.
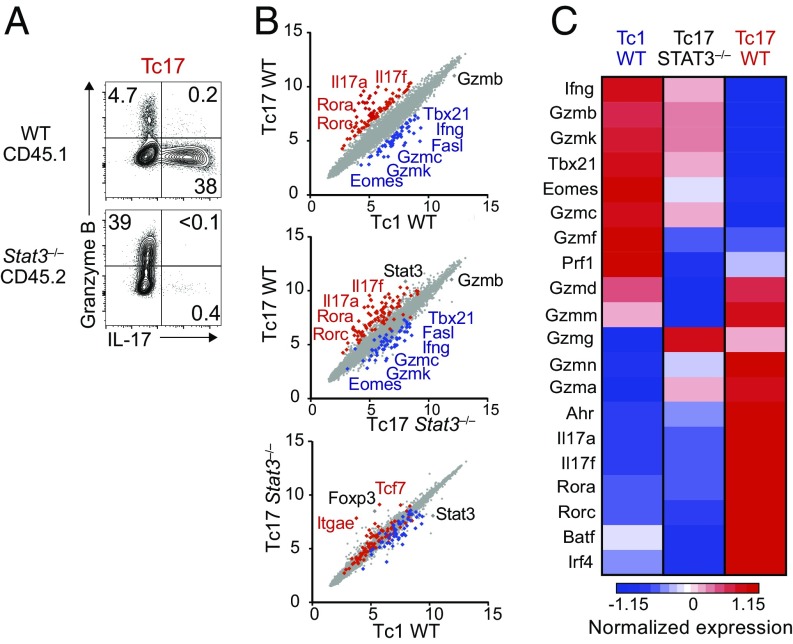
STAT3 represses cytotoxic gene expression in CD8+ T cells. (A) Contour plots of IL-17 vs. granzyme B intracellular expression in CD8+ T cells cocultured under Tc17 conditions as shown in Fig. S2A. Data are gated on WT CD45.1+ or Stat3−/− CD45.2+ cells and are representative of three mice per genotype analyzed in three independent experiments. (B) Scatterplots show microarray gene expression (log2 values, full gene set) in indicated cell populations after sorting from mixed cultures set as in Fig. S2A. Genes with 1.5-fold or greater expression change in wild-type Tc17 vs. Tc1 cells (P < 0.05) are defined in the Top plot and shown in red and blue in all three plots. Relevant genes are indicated. Data are from three replicates. (C) Heatmap displays normalized expression on selected genes in Tc1 WT, Tc17 WT, and Tc17 Stat3−/− cells (Z score, color scale at Bottom). Data are from three replicates.

