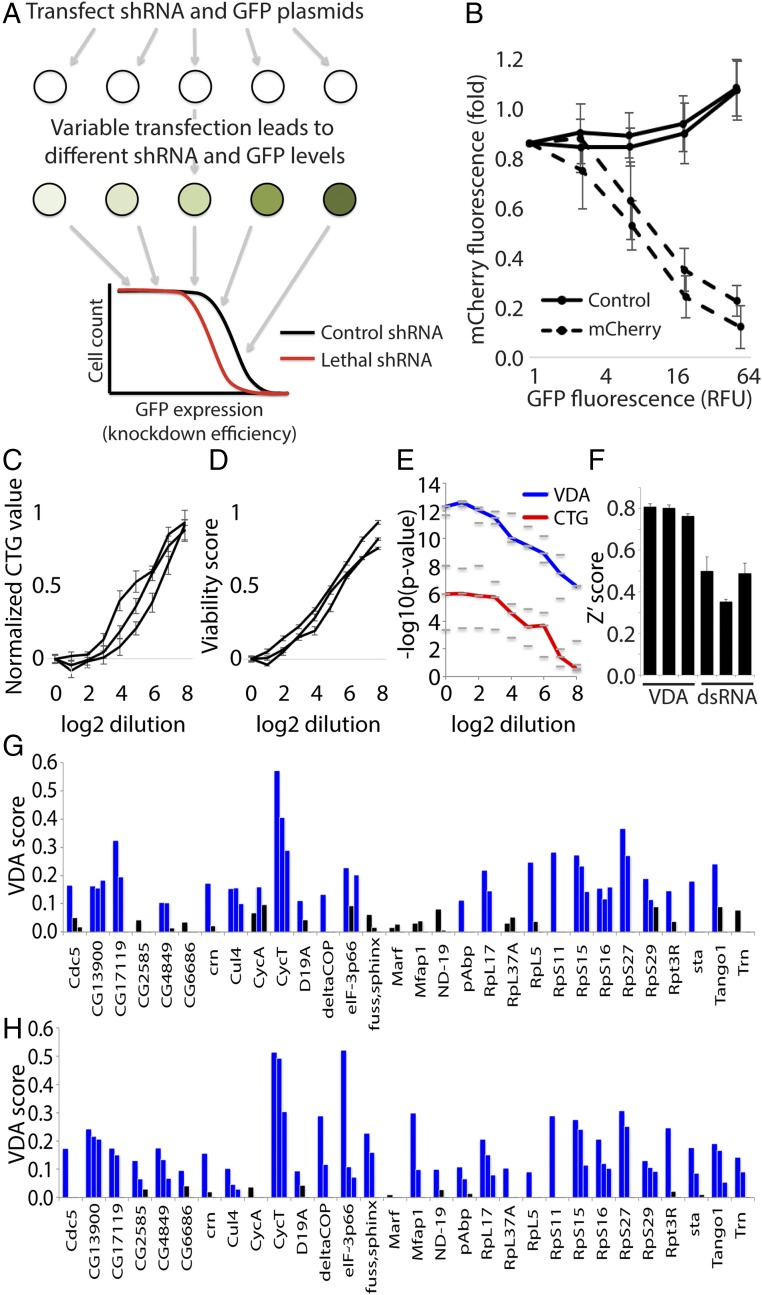
Fig. 2.
VDA is an effective method to measure viability phenotypes and detect SS/L interactions. (A) Schematic illustrating the experimental setup of VDA assays. (B) Graph illustrating the relationship between GFP fluorescence and target-gene knockdown efficiency. mCherry fluorescence was used as a measure of knockdown efficiency and is displayed as a fold change to cells with no detectable GFP expression. Each line represents the average of three biological replicate experiments using an independent shRNA reagent targeting mCherry (dashed lines) or white (solid lines). Error bars indicate SEM. (C and D) Graphs showing cell viability measured using either CTG (C) or VDA (D) assays over a range of thread RNAi dilutions. Measurements are normalized to both positive (thread RNAi) and negative (white RNAi) controls to allow simple comparison between the two methods. Lines show average readings from six replicates in each case. Multiple groups of replicates are shown to better illustrate consistency between experiments. Error bars indicate SEM. (E) Graph illustrating the improved ability of VDA assays (blue line) to detect viability phenotypes compared with CellTiter-glo assays (red line) performed on the same populations of cells. Dashes represent −log10 P values calculated from three independent groups of six replicate experiments. The lines represent the median value of the three dashes. These data were calculated from the same experiments represented in C and D. (F) Bar graph illustrating average Z′scores from three independent replicate experiments, each consisting of 30 biological positive control replicates and 30 biological negative control replicate measurements. Each bar represents a different pair of positive and negative control reagents measured using dsRNA/CellTiter-glo or VDA assays as indicated. Error bars indicate SEM. (G) Results from VDA assays targeting 30 different genes as indicated. Each bar represents a different shRNA reagent (three per gene). Blue bars indicate samples with a VDA score greater than 0.1, and black bars represent VDA scores less than 0.1. (H) Graph displaying VDA results as in G but with VDA analysis performed including cell size correction.

