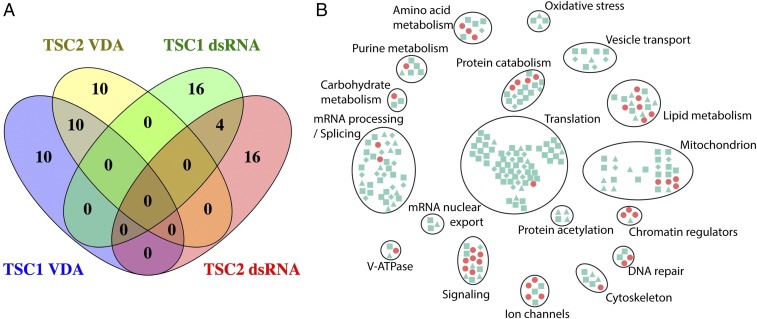
Fig. 3.
An integrated network analysis of TSC dependencies. (A) Venn diagram showing overlap of genes between the top 20 ranked hits from the VDA or dsRNA screens performed in TSC1 or TSC2 cells. (B) Network diagram showing genes identified as SS/L with TSC1 and/or TSC2. Symbols represent individual genes identified from dsRNA screens (light green) or VDA screens (red). Symbol shapes indicate confidence with which hits from dsRNA screens were identified (diamond, high confidence; square, medium confidence, and triangle, low confidence). Gene cluster functions were defined based on manual curation of component functions.

