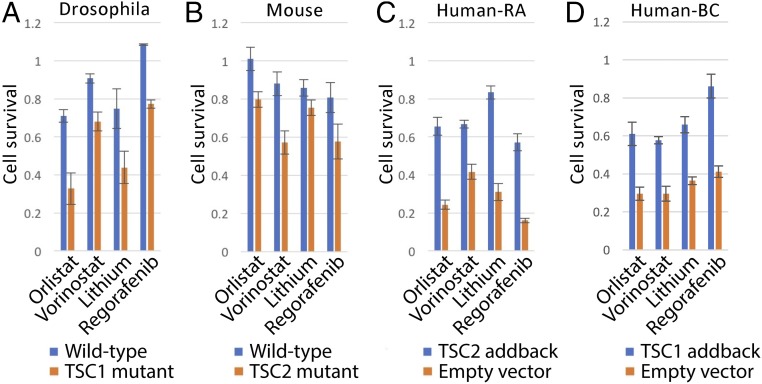
Fig. 4.
Identification of drugs with selective effects on TSC-deficient cells. (A–D) Bar graphs illustrating cell viability as measured using CellTiter-glo assays in the presence of the indicated drugs, normalized to vector alone. Bars represent the average of at least six replicate measurements either in wild-type (blue bars) or TSC1/2-deficient (orange bars) (A and B) or in TSC1/2-deficient cells with empty vector (orange bars) or TSC1/2 cDNA (blue bars) addback (C and D) cells as indicated. Error bars indicate SEM. “Human-RA” indicates human RA-derived cells and “Human-BC” indicates human bladder cancer-derived cells.

