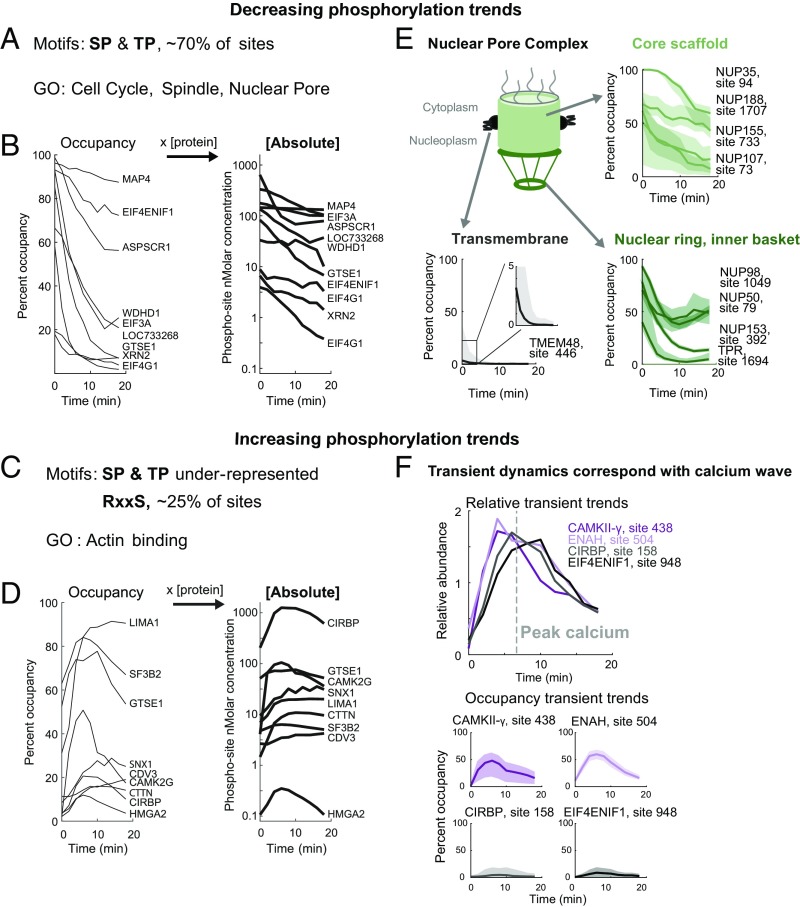
Fig. 6.
Phosphosite dynamics following egg activation: Analysis of the phosphorylation trends (increasing and decreasing) following egg activation with individual examples. (A) Motif enrichment analysis (P << 0.01) results and gene set enrichment analysis (GSEA) of GO terms (P < 0.01) results for dephosphorylated proteins. (B) Time series of selected proline-directed phosphorylation plotted as occupancy and absolute phosphate dynamics (log10 transformed). All trends shown pass a 95% confidence interval width threshold of ±25%. (C) Motif analysis results as in A for proteins with increasing phosphorylation trends and GSEA results. (D) Examples of increasing phosphorylation (plotted as in B). (E) Phospho-occupancy trends showing differential dephosphorylation of nuclear pore complex (NPC) regions with confidence intervals. (F) Relative and phospho-occupancy time series of proteins showing transient trends corresponding to the peak of calcium concentrations.

