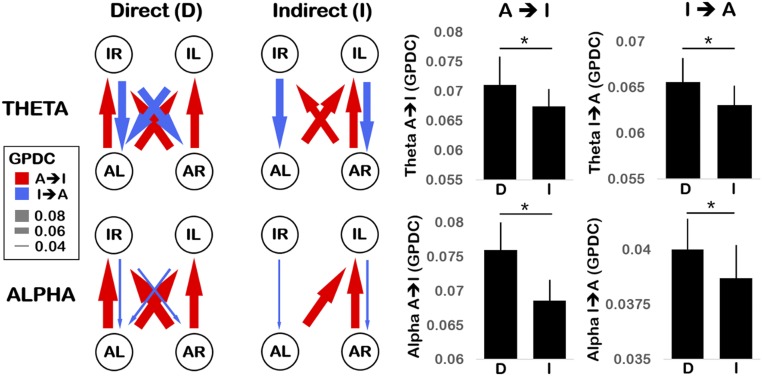
Fig. 3.
(Left) Network depiction of experiment 2 Theta (3–6 Hz, Top) and Alpha (6–9 Hz, Bottom) connectivity, plotting GPDC values for direct (Left) and indirect (Right) gaze conditions. Nodes represent C3 (L) and C4 (R) electrodes for adult (A) and infant (I). Arrows indicate the direction and strength of connectivity (higher GPDC value, thicker arrow). Connections that do not significantly exceed the surrogate threshold are excluded. (Right) Grand mean GPDC values averaged across all adult-to-infant (A → I, Left) and infant-to-adult (I → A, Right) connections for Theta (Top) and Alpha (Bottom) in direct (D) and indirect (I) gaze conditions. Error bars show the SEM. *P < 0.05.

