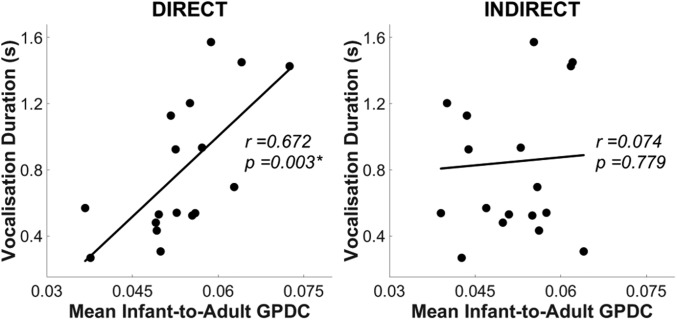
Fig. 4.
Scatterplots showing the correlation between (n = 19) individual infants’ mean infant-to-adult GPDC value (averaged across Theta and Alpha bands, x axis), and their vocalization duration (y axis) in experiment 2. Left and Right show direct and indirect gaze conditions, respectively. *P < 0.05 (Benjamini–Hochberg FDR corrected).

