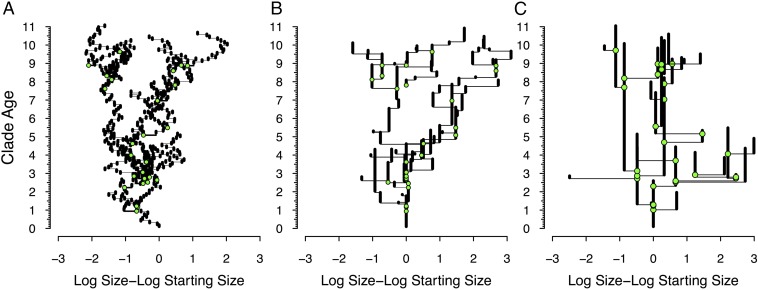
Fig. 1.
Three models of continuous change on the same phylogeny, with cladogenetic events (green circles) and lineage lifetimes following exponential distributions. The x axis gives the (log) difference between the original body size and the derived size. Note that the actual phylogeny is identical in all three figures. (A) Brownian motion. Here, each “generation” shows some shift following a lognormal distribution. (B) Jump (pulsed) model. Here, shifts are exponentially distributed over time within lineages and follow a lognormal distribution with larger log-variance. (C) Punctuated equilibrium. Here, shifts coincide with cladogenesis and follow a lognormal distribution with still larger log-variance.

