Figure 6.

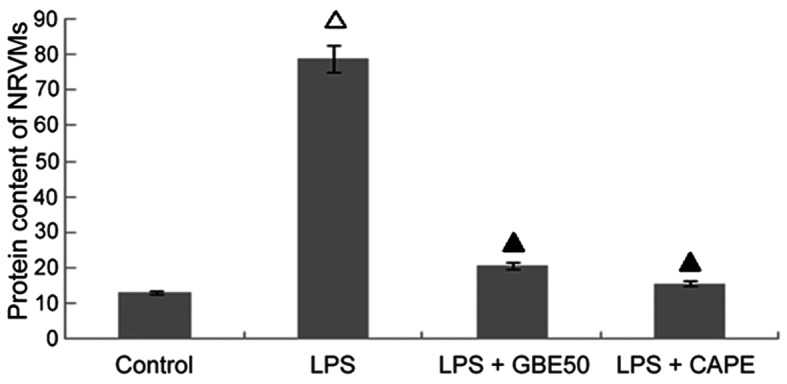
Protein content of each group. △P<0.01 compared with control group; ▲P<0.01 compared with the lipopolysaccharide (LPS) group.

Protein content of each group. △P<0.01 compared with control group; ▲P<0.01 compared with the lipopolysaccharide (LPS) group.