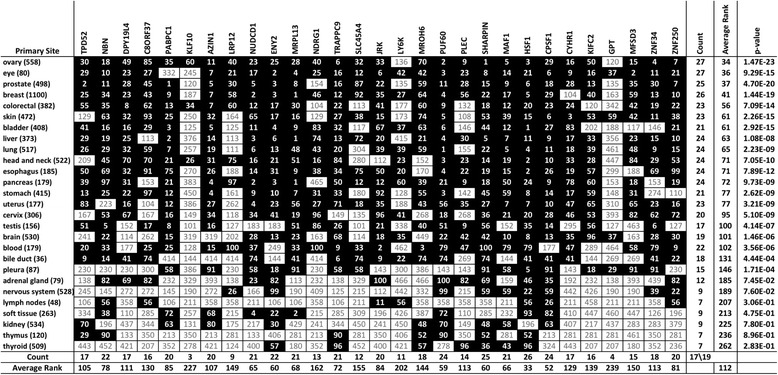
Table 2.
Ranks of HSF1-CanSig 8q genes by primary tumor site. The bracketed number next to the name of a primary site denotes the number of cases recruited in the study. Genes displayed in the table heading are arranged in a syntenic order. The number inside a cell denotes the rank of the gene among HSF1-CanSig genes with the most frequently overexpressed genes ranked 1. Ranks ≤ 100 are highlighted in solid black. Some genes may share the same rank if they have the same overexpression score. Count includes only genes with rank ≤ 100. Average rank is the arithmetic mean of ranks. HSF1-CanSig genes GPT and LRP12 are not part of the top 100 high-scoring genes. p value is determined by one-sample two-sided Student’s t test. The table is sorted by average rank and count in ascending and descending order, respectively

