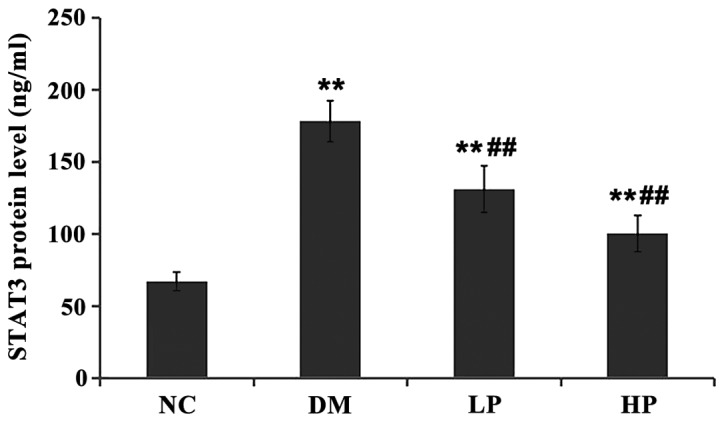
Figure 4.

Compared with the control group, the STAT3 protein levels in DM, LP and HP groups were significantly higher. Compared with DM group, the STAT3 protein levels in LP and HP groups were significantly lower. (Compared with NC group, **P<0.01; compared with DM group, ##P<0.01).
