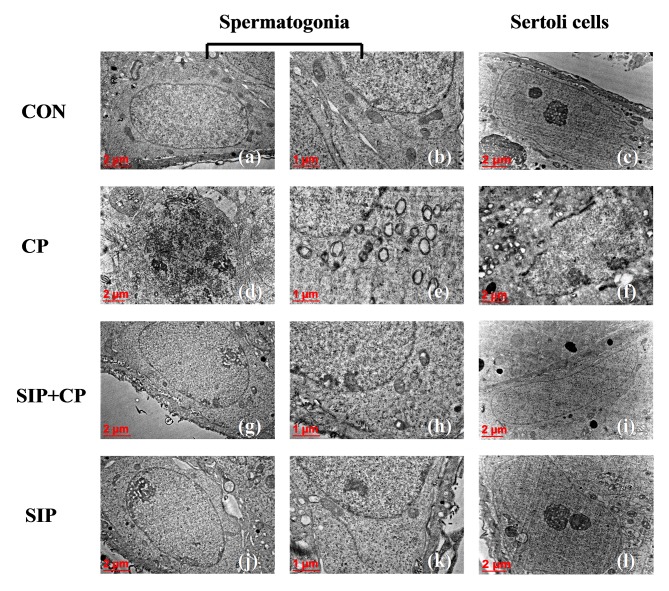
Figure 4.
Ultrastructure of testicular spermatogonia and Sertoli cells in four groups of mice as assessed by transmission electron microscopy. Images were obtained at magnifications of ×12,000 (c, f, i, l), ×15,000 (a, d, g, j), ×30,000 (b, e, h, k). CON, control mice; CP, CP-treated mice; SIP+CP, mice treated with squid ink polysaccharide and CP; SIP, squid ink polysaccharide-treated mice.

