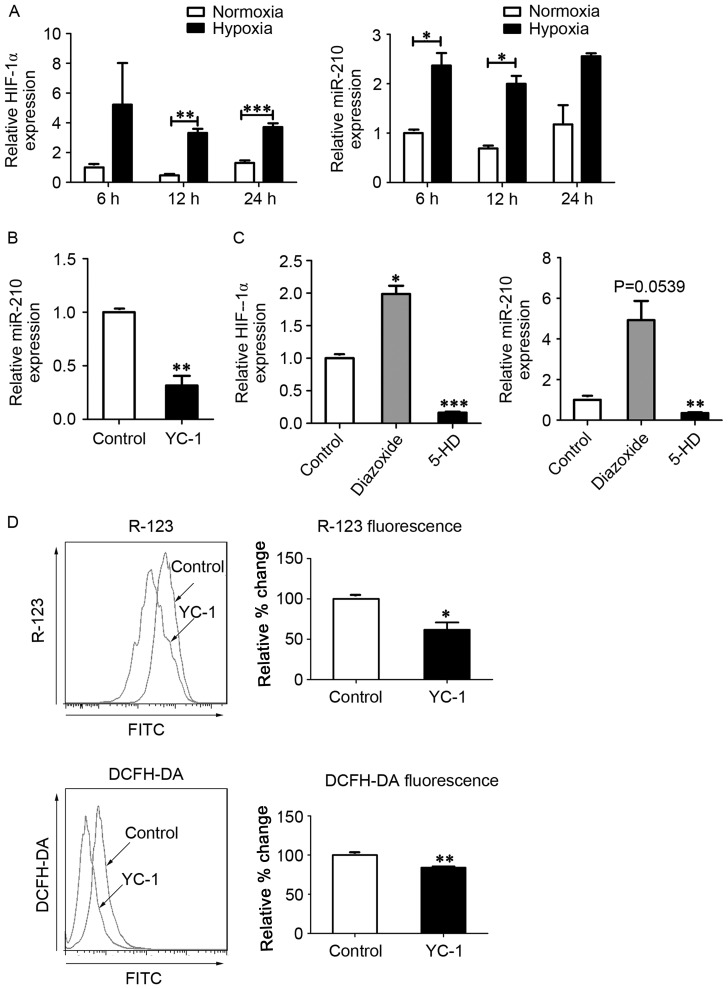
Figure 2.
MitoKATP interacts with HIF-1α in a positive feedback manner. (A) Expression of HIF-1α and miR-210 was assessed by qPCR after cells were exposed to normoxia or hypoxia for 6, 12 and 24 h. Data are expressed as the mean ± standard deviation (n=3). (B) hPASMCs were treated with YC-1 upon hypoxia for 12 h, and the expression of miR-210 was measured by qPCR. The value was relative to the control without YC-1, using U6 as a reference. (C) hPASMCs were treated with 5-HD or diazoxide in a hypoxia state for 12 h, and the expression of HIF-1α and miR-210 was measured by qPCR. The value was relative to control (untreated) cells, using β-actin as a reference. (D) hPASMCs were treated with YC-1 upon hypoxia for 12 h. Left: Intracellular ROS content analyzed by DCFH-DA fluorescence. Right: ΔΨm analyzed by R-123 fluorescence. Left and right: Results were expressed as a percentage of control (untreated) cells and were presented as the mean ± standard deviation (n=3). *P<0.05, **P<0.01 and ***P<0.001 vs. control. Data were analyzed by a Student's t-test. MitoKATP, mitochondrial ATP-sensitive potassium channel; HIF-1α, hypoxia-inducible factor-1α; miR, microRNA; qPCR, quantitative polymerase chain reaction; hPASMCs, human pulmonary artery smooth muscle cells; YC-1, 3-(5′-hydroxymethyl-2′-furyl)-1-benzylindazole; 5-HD, 5-hydroxyde-canoate; DCFH-DA, 2′,7′-dichlorofluorescin diacetate; ΔΨm, mitochondrial membrane potential; R-123, rhodamine-123.

