
Figure 3. RNA-sequencing in Fmr1 KO neurons.
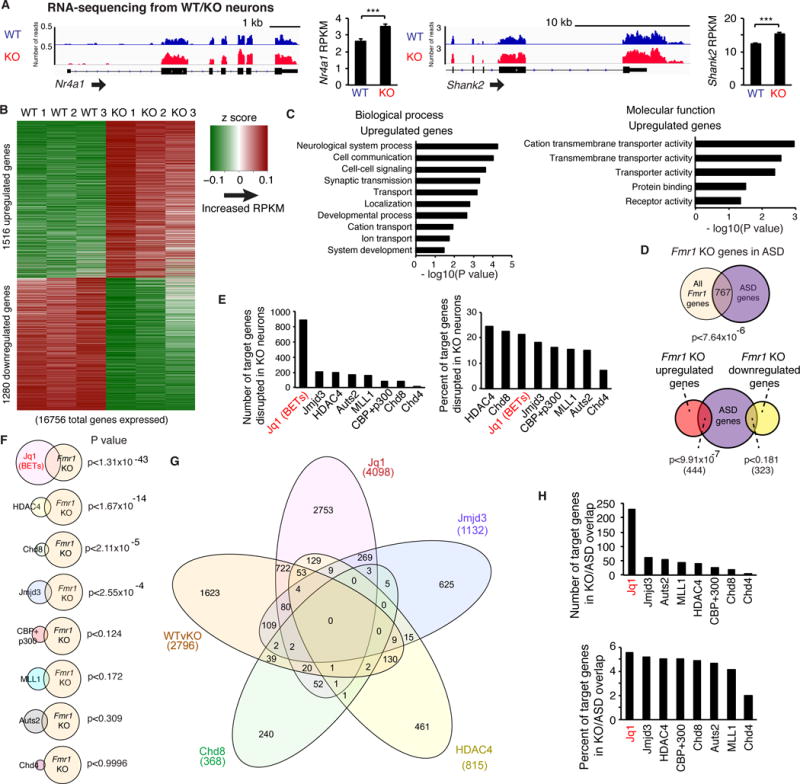
(A) Gene tracks and average RPKM for Nr4a1 and Shank2 in WT and Fmr1 KO cultured neurons. n = 3 replicates. (B) Z scores of significantly changed genes in Fmr1 KO neurons. (C) Gene ontology analysis of upregulated genes. (D) Overlap of KO misregulated genes with ASD linked genes. (E) Number and percentage of target genes of chromatin-associated proteins found in the FMRP HITS-CLIP analysis that overlap with KO misregulated genes. (F) Significance of the overlap. (G) Venn diagram of KO misregulated genes and target genes of all chromatin-associated proteins that show significant overlap with KO genes. (H) Number and percentage of target genes of chromatin-associated proteins that overlap with KO misregulated genes also linked to ASD. ***p < 0.001, DESeq adjusted p value. Overlap p values, hypergeometric test. Graphs in A show mean ± SEM. See also Figure S3 and Table S2.