
Figure. 5. Effects of JQ1 on KO neurons.
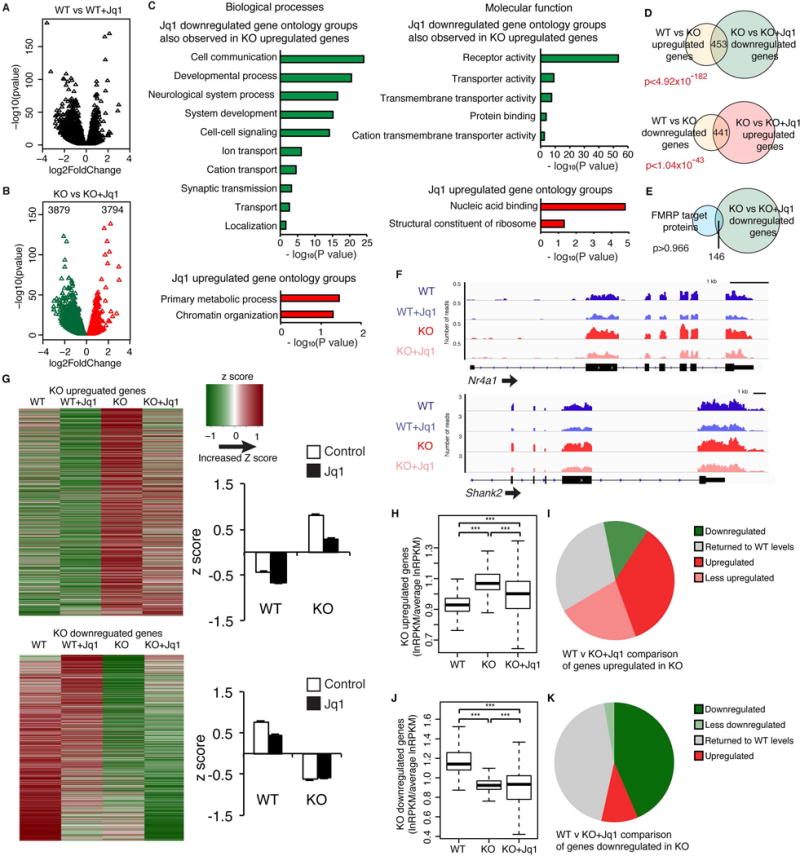
(A, B) Volcano plot of JQ1-regulated genes in WT (A) and KO (B) neurons. (C) Gene ontology groups disrupted in KO that are oppositely regulated after JQ1 treatment of KO. (D) JQ1 downregulated genes significantly overlap with KO upregulated genes and vice versa. (E) JQ1 downregulated genes do not significantly overlap with FMRP target genes. (F) Gene tracks in WT and KO neurons with JQ1 treatment. (G) Heat map and box plot of z scores of up and downregulated KO genes with JQ1 treatment. (H, J) Box plot of the effects of JQ1 on the relative RPKM values of genes that are up (H) and down (J) in KO neurons. (I, K) JQ1-induced changes in KO neurons for genes that are up (I) and down (K) in KO neurons. n = 3 biological replicates. ***p > 0.001, ANOVA with post hoc paired two-sided t-test. Overlap p values, hypergeometric test. Graphs in G show mean ± SEM. See also Figure S5, Table S3, and Table S4 for ANOVA values.