
Fig. 2.
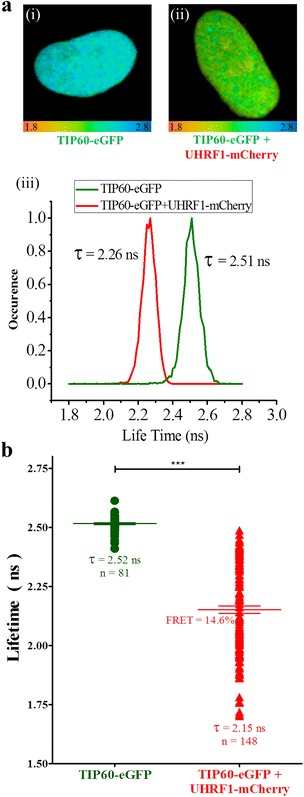
Interaction of TIP60-eGFP with UHRF1-mCherry evidenced by FRET-FLIM. a 25 μm × 25 μm FLIM images of HeLa cells transfected with TIP60eGFP (i) or co-transfected with TIP60-eGFP and UHRF1-mCherry (ii) and lifetime distribution curve (iii). Color coded images indicate the fluorescence lifetime of TIP60-eGFP at each pixel. Color scale codes for lifetimes ranging from 1.8 ns (red) to 2.8 ns (blue). b Fluorescence lifetimes in TIP60-eGFP ( ) and TIP60-eGFP + UHRF1-mCherry co-transfected cells (
 ). Values are means ± SEM from five independent experiments. For statistical analysis, a Student’s t-test was performed (*** P < 0.001)