
Fig. 7.
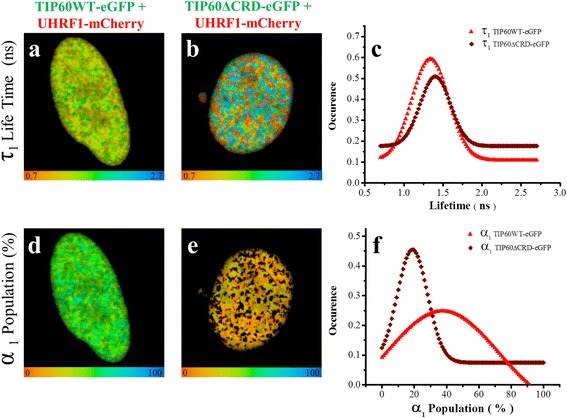
Two component analyses of the fluorescence decays of TIP60WT-eGFP and TIP60∆CRD-eGFP lifetime in presence of UHRF1-mCherry. Fluorescence decays were measured at each pixel for the respective cells by using bi-exponential model. In this model, the long-lived lifetime component (τ2) was fixed to the lifetime of Tip6WT-eGFP when it is transfected alone in HeLa cells (2.52 ns). a 25 μm × 25 μm FLIM image of the distribution of τ1 lifetimes of TIP60WT-eGFP in the presence of UHRF1-mCherry (corresponding to the component undergoing FRET). b 25 μm × 25 μm FLIM image of the distribution of τ1 lifetimes of TIP60∆CRD-eGFP in the presence of UHRF1-mCherry (corresponding to the component undergoing FRET). Color scale codes for lifetimes ranging from 0.7 ns (red) to 2.7 ns (blue). c Distribution of τ1 lifetimes of TIP60WT-eGFP and TIP60∆CRD-eGFP transfected cells in presence of UHRF1-mCherry. d 25 μm × 25 μm FLIM image of the population α1 of TIP60WT-eGFP undergoing FRET in the presence of UHRF1-mCherry. e 25 μm × 25 μm FLIM image of the population α1 of TIP60∆CRD-eGFP undergoing FRET in the presence of UHRF1-mCherry. Color scale codes for population ranging from 0% (red) to 100% (blue). f Distribution of population α1 for TIP60WT-eGFP and TIP60∆CRD-eGFP transfected cells in presence of UHRF1-mCherry. Values indicated are from 148 TIP60WT-eGFP and UHRF1-mCherry co-transfected cells from five independent experiments and 65 TIP60∆CRD-eGFP and UHRF1-mCherry co-transfected cells from three independent experiments